Technical Paper
Setting up and Operating a Cost Effective Predictive Maintenance Program at Champion Paper Company
“We developed one program that allows our mechanics the opportunity to spend two to three days working with the system, outlining what we are trying to accomplish and providing basic information about how the system works. This plant is only two years old, and we are fortunate that our upper management decided to go with a predictive maintenance program from the very beginning”, advised John Daniels, predictive maintenance specialist at the Champion Paper Company plant in Quinnesec, Michigan.
“We have two people assigned full time for vibration analysis, plus two SKF Microlog portable data collectors, an IBM PC computer with a Bernoulli box, a real time analyzer and plotter, and a printer”.
The predictive maintenance program currently monitors approximately 6 600 points. For each unit they take vertical, horizontal and axial readings so that one motor and pump would represent 12 monitoring points. There is one weekly route that is run each Thursday and consists of critical equipment that affects production throughout the entire plant. In addition, there are 29 monthly routes and two quarterly routes, with each route including approximately 250 points and taking 2 to three hours to cover.
“At first, we listed every piece of equipment in the plant that we wanted to monitor and divided those into four areas: the pulp machine, the pulp mills, the boilers and the wood yard area”, he continued. “We had approximately 1 000 machines that we wanted to look at, and thought that a monthly schedule would be the most efficient for the majority of the points. In fact, after we set up the routings, we found that we could conveniently include less critical points that were in the same area, and monitor them on a monthly rather than quarterly basis”.
When the program was started two years ago, they looked at a variety of vibration monitoring equipment and selected the SKF Microlog system developed by SKF USA Inc., Condition Monitoring Center – San Diego. “At the time we selected SKF USA Inc., their sys-tem offered some of the most enhanced features available”, he added. “In fact, we were a beta test site for them, and were able to work closely with them on any questions, concerns or problems that came up”.
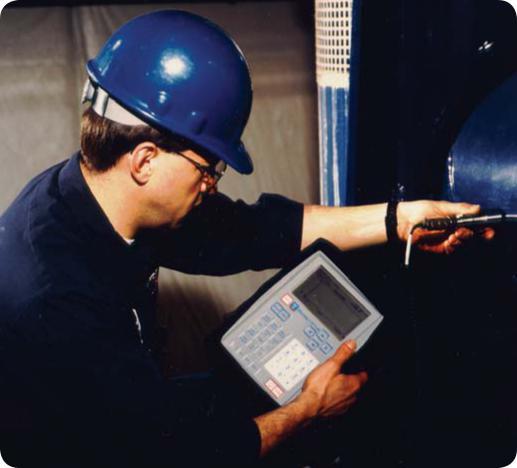
Fig. 1. SKF Microlog portable data collector.

“One of the most important considerations that we found in integrating this technology into our plant was educating our people. We devel-oped one program that allows our mechanics the opportunity to spend two to three days working with the system, outlining what we are try-ing to accomplish, and providing basic information about how the system works. We let them load the SKF Microlog with the computer, go out and take a route, then dump the data back into the computer”.
“This experience is important for two reasons. First, it helps them understand what we are trying to do in this department and how it relates to their jobs, and second, if a problem develops during the second or third shifts when our people are not here, one of these mechanics can come to our office, pick up one of the SKF Micrologs and use it to record critical information. They might not understand all of the details of the program, but they can be very helpful in an emergency”.
“We are also in the process of developing a similar program for all of our managers and production people, providing an overview of what we are doing and the types of information that we collect and process. We have found that some managers who were not aware of vibration analysis have been amazed at what we have been able to do, and in the process they too have become believers”.
Even though the plant is relatively new, there have already been a number of situations where the predictive maintenance program has been particularly cost-effective. “One of the systems is a 1 250 hp primary cleaner pump motor that we monitor on a monthly basis,” he con-tinued.
“We noticed that the system had a high axial vibration reading, and by trending the data we found that it was consistently climbing each month. We scheduled to replace it during the next scheduled downtime, and when we got it into the shop we found that the motor had a 0.050 in. differential in the air gap fitting. That is something that you can’t see, feel or hear, and without the analysis we would have run the motor until it had failed, probably when we could least afford it at 3 a.m. some morning”.

Fig. 2. By trending vibration readings, they can identify developing problems that otherwise would go undetected.
2

“Production downtime represents a significant cost for us, in addition to the cost of parts and labor to repair a piece of equipment, so that experience alone saved us thousands of dollars”.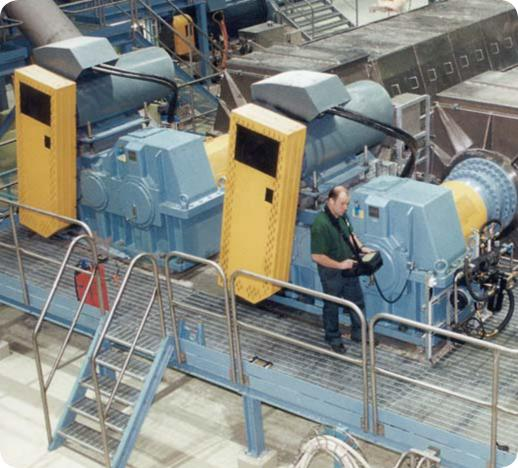
“We make a point of documenting each of these instances where the predictive maintenance program has made a difference, and we can present the data in a variety of reports and graphs. We keep educating our management on the types of problems that we control or prevent and put these abilities into the financial and production terms that they more easily understand. As a result, our manage-ment usually supports our annual budget requests, as well as requests for special project funding”.
“We are also constantly working to improve the efficiency of the program. We are currently re-evaluating which pieces of equipment are included in the program and we are trying to determine if we can reduce the number of points that we monitor on each machine from say 12 points to eight points. If we can reduce the number of points that we monitor in the current program, we will be able to add more of the less critical points to the schedule and expand our information data base even more”.
“The best advice for someone who is considering starting up a
predictive maintenance program is to sit down and identify what equipment you have and what you want to accomplish,” he concluded. “Over the last three years a lot of new diagnostic equipment has been developed, and you can accomplish just about anything that you might want with one form of the technology or another”.
“However, if you do not have a clear idea of what you want, you may end up with state-of-the-art technology that sits on the shelf or that provides information that really isn’t useful”.
3
Please contact:
SKF USA Inc.
Condition Monitoring Center – San Diego
5271 Viewridge Court · San Diego, California 92123 USA Tel: +1 858-496-3400 · Fax: +1 858 496-3531
Web: www.skf.com/cm
- SKF is a registered trademark of the SKF Group.
All other trademarks are the property of their respective owners.

© SKF Group 2012
The contents of this publication are the copyright of the publisher and may not be reproduced (even extracts) unless prior written permission is granted. Every care has been taken to ensure the accuracy of the information contained in this publication but no liability can be accepted for any loss or damage whether direct, indirect or consequential arising out of the use of the information contained herein.
PUB CM1002 EN · January 2012
Comments
0 comments
Please sign in to leave a comment.