Observer-Collect trend overall with spectrum
When a spectrum is stored, a overall should be stored in the trend also.
Trend and spectrum should always be synchronized.
If there is a trend alarm, a spectrum should be stored and synchronized.
-

You can post process Overall Values for Spectra with Diagnosis rules, then you have synchron readings available.
For IMX-1 and Microlog they are synchron availbable.
If a alarm is triggered in the system (considering the hysteresis) additionial readings are taken. Therefore check your Trend alarm settings. After that you can controll the data collection rate with own intervall. After reset of the Alarm contiction (system side, not aknowledgment in Software) a new alarm will trigger new reading.
-

Many machines we monitor are variable speed, variable load, so the overall value changes rapidly. What we are saying is the trend that is displayed has no analysis value. We need it replaced by values that we can correlate and analyze quickly- not with additional steps. There too many clicks involved. The number of clicks takes a toll on the alertness and problem solving capability. Furthermore, we see that many users and potential customers find the Observer overall trend confusing. We need less steps and more clarity to be competitive.
-
Well, without concrete data my reply might be a bit generig, but in general we try to store relevant data only. IMX device should gate relevant data. In most cases the Gating is a crucial point here. For online devices there are two gatings possible in the Measurement point, you even can split between Trend and Raw data (but mostly they kept synchron). If this is not enought the Multiple Gating point is an option to extent here the number of inputs.
Another way might be, to have multiple measurement task but with different gatings already setup. It might be more simple then using the adaptive alarming. There are machines that have shown that 90% of operating data is not worth to collect or at least to use for the analysis of the spectra. But this is only a can, you need to verify such assumptions, but this helps in the long perpective. Another option can be a defined test cycle, that means double MP, Gate one in defined condition, so that it producesses stable trends and easy comparable Spectras and use the other point to collect all as the operating condition require a high data collection reates.
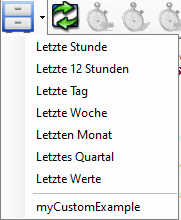
Depending on your data correlation you might consider to use Quick data collection. You can define filters on the data filters, and choose them by quickly (stored customized).
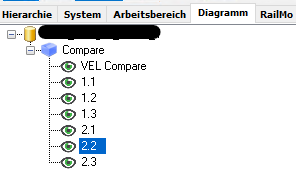
Other options to get quickly to certain views are Workspaces and Diagram
For machines with highly changing operating condition also Diagnosis rules with a % of Overall logic instead of classic rms can be a solution.These are examples that might help in the current solution, I typically check with customers which suits best for there needs. No one uses all possibilities that are offered, but we will also not come to a complete unified solution. And also we need to adopt to the future, so even with that many solution we might have open points which are not in the system. I'm interested: How would you reduce the number of clicks?
Please sign in to leave a comment.
Comments
3 comments