

Introduction
SKF @ptitude Analyst has an easy way to identify that a spectrum has changed from the “normal” situation. In many cases, peaks in a spectrum are compared to its previous level. If a peak is growing, this can lead to early identification of a machine failure. Most of the early indicators in a spectrum are not the typical clear and large “wall chart” data signatures; most early indicators are low in amplitude.
Measurement Routes Complexity
On a typical route-based condition monitoring setup, each component of a machine train has at least four (4) collection points and several types of data obtained from each point.
Readings in Velocity, SKF Acceleration Enveloping with Filter 3 and Filter 4 and Acceleration at a higher frequency range are normally collected. Based upon the machine type, additional measurements can be added. For all of these measurement types, the user may choose to store Overall, Spectrum and/or Time Domain data.
A typical route with the above measurements for 100 machines collected on an average morning will return over 3000 pieces of data.
With this amount of data, it is impractical to review the details of every spectrum, waveform, overall velocity level and SKF envelope overall level each time a measurement is collected. Instead, many analysts rely on the overall value and set alarms. Using just the overall value over set alarms as an indication of an upcoming problem is not effective in detecting all of the issues early enough to prevent failure.
Spectrum Envelope
The Spectrum Envelope in SKF @ptitude Analyst allows the user to compare the measured spectrum against a contour of a known-good spectrum. When there is a spike in the spectrum that is higher than the contour line, a Spectrum Envelope alarm is generated.
The 'Generate Spectrum Envelope' function allows the user to create an alarm line above the spectrum that follows the contour of the spectrum. Later, if there is a spectrum with a peak that breaches the alarm line, a Spectrum Envelope alarm will be generated.
Spectrum Envelope alarms are created In the POINT Properties setup window [Figure 1] in SKF @ptitude Analyst.
Once in POINT Properties, select the Envelope tab and then choose a spectrum to use as the basis for the alarm generation. Click Generate to proceed.
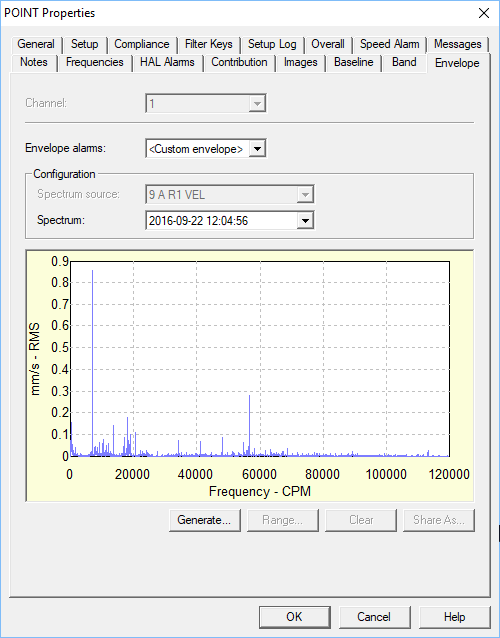
Figure 1. Spectrum Envelope setup within POINT Properties window
An additional setup dialog for envelope parameters [Figure 2] will be displayed. The following settings can be applied:
- % Overdrive – Enter the percent of the POINT’s full scale value to determine the height of the envelope alarm above the spectral peak. The smaller the number specified, the tighter the comparison envelope conforms to the designated spectrum.
- Spreading % – Enter percent of full scale (or center frequency) to increase the width of the envelope alarm around spectral peaks. The smaller the number specified, the tighter the envelope conforms to the sides of the peaks in the specified spectrum.
- Spreading Type – (either Center Frequency or Full Scale). If Center Freq. is selected, the bandwidth about each center frequency increases with higher frequencies. If Full Scale is selected, the bandwidth about each center frequency is constant, based on a percent of the full scale frequency.
- Threshold – Enter % of the POINT’s full scale value, or an absolute value. The threshold value provides an opportunity to eliminate false alarms due to vibration "noise."
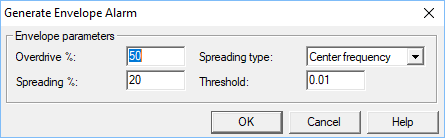
Figure 2. Envelope parameters setup
The settings above generate the Spectrum Envelope contour shown in Figure 3.
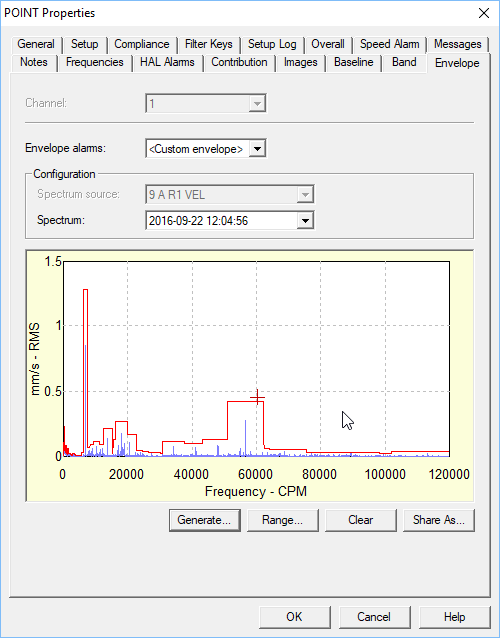
Figure 3. Spectrum contour based on setup above
Notice the wider band around the peak at 60000 CPM and the smaller steps on the left side of the spectrum. The step size depends on the center frequency as selected by the spreading type.
Since not all parts of the spectrum need the fine step size, the contour line is edited by using a mouse or keyboard. In this example, there is a lot of noise on the left side of the spectrum. If we were to raise the level, it would be less likely that the low frequencies will go over the alarm line. The edited line looks like the plot in Figure 4 below.
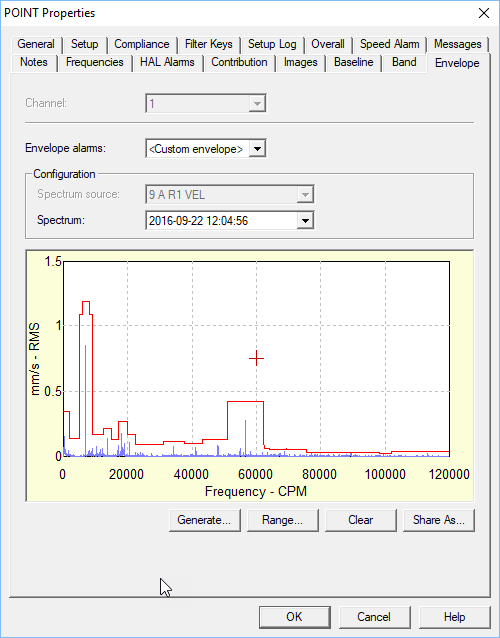
Figure 4. Edited spectrum line
Using the Range button, it is possible to quickly change the level between two (2) frequencies. When Range is clicked, the 'Set Frequency Range' dialog appears [Figure 5].
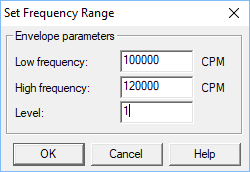
Figure 5. 'Set Frequency Range' dialog
These values set the alarm line at a level of 1 mm/s between 100000 and 120000 CPM [Figure 6].
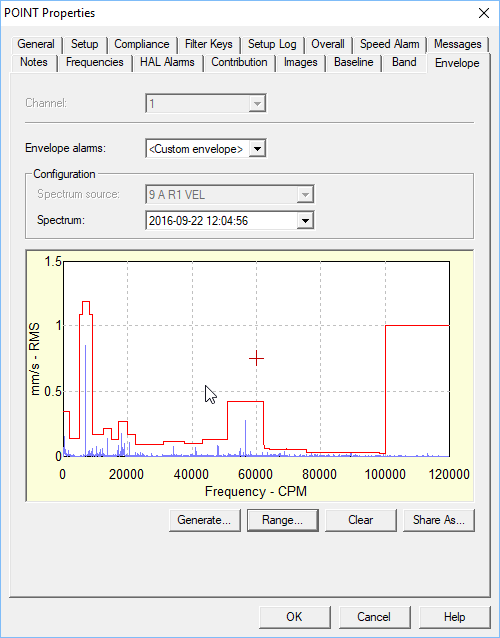
Figure 6. Alarm spectrum reflecting set frequency levels
Spectrum Visualization
On a normal spectrum view, the Spectrum Envelope can be displayed using the 'Envelope Alarm' overlay. This overlay can be added by going to View > Plot Overlays > All Overlays or by clicking the icon 
The resulting plot is shown in Figure 7.
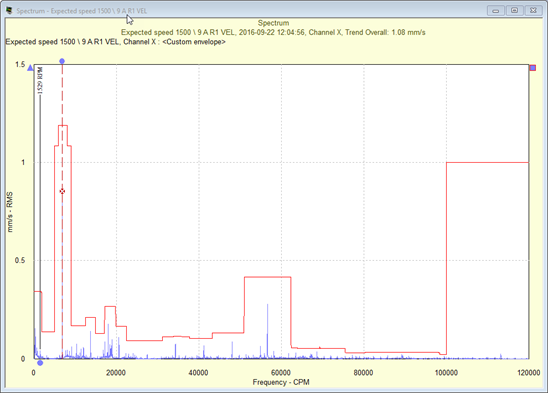
Figure 7. Using the 'Envelope Alarm' plot overlay
When necessary, the Spectrum Envelope Alarm can be shared with other measurements using the Share As button. After a name is selected, the Envelope Alarm setting will be stored in the database. The name used will serve as a reference to link the Envelope Alarm to other measurement points.
When a shared Envelope Alarm is modified, the changes will be implemented in all measurements where the shared Spectrum Envelope Alarm is used.
Comments
0 comments
Article is closed for comments.