Summary
This article describes how to configure a Microlog Dynamic point in @ptitude Observer that will facilitate capturing data from two vibration sensors and support displaying that data in an Orbit plot.
Details
In @ptitude Observer, create a Microlog Dynamic point, with No. of directions set at 2 (two vibration sensors active):
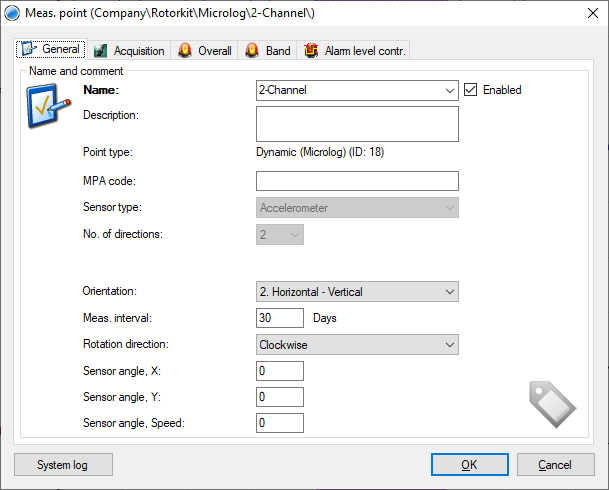
A suitable Orientation should also be picked from the drop-down. Six possibilities are available for selection, three each for horizontal and vertical machines:
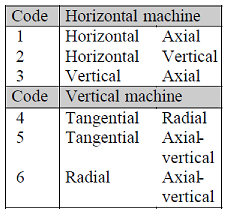
Use the following graphic to understand how the measurement direction naming used in the orientation drop-down (for example Horizontal, Tangential etc.), translates into measurement locations on the horizontal or vertical machine:
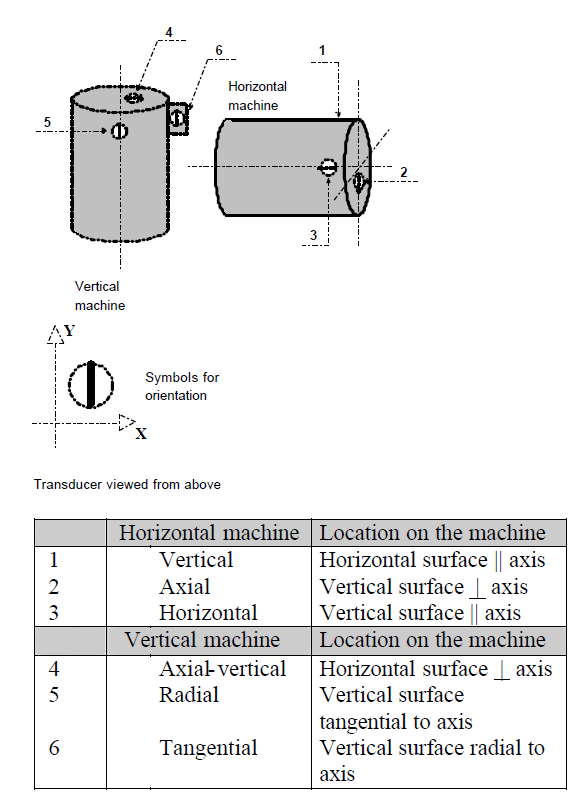
- The table above uses symbols to to indicate "parallel to" or "at right angles to" the shaft axis.
Next, in the Acquisition tab, select Save as "Time waveform" and set the speed of the machine (and if a speed measurement will also be available, configure that):
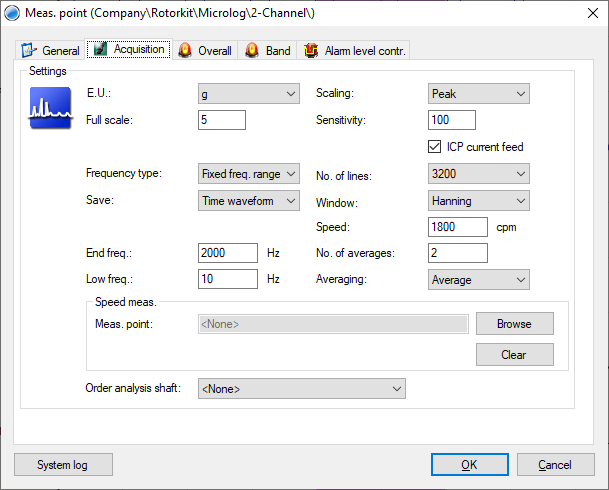
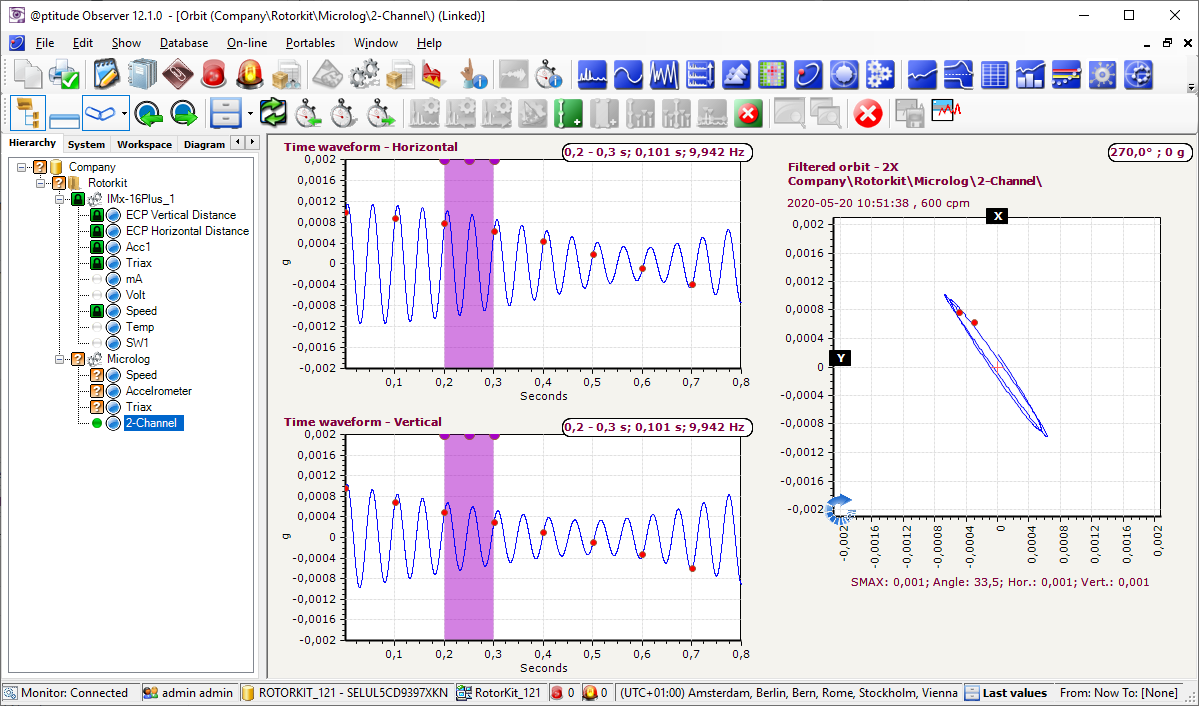
Complete any other required configuration, save and download to the Microlog. After uploading the captured 2-channel data, it can be viewed in an @ptitude Observer, Orbit plot:
Contacting SKF Technical Support Group
For further assistance please open a support case using the Technical Support group's self-help portal at www.skf.com/cm/tsg. Once your support case is submitted, a technician will contact you to begin working on your issue. For urgent issues we are available at these times by phone:
- Monday through Friday, 5:00 a.m. to 4 p.m. Pacific Time -
Phone: +1 800 523 7514 within the US or +1 858 496 3627 outside the US. - Monday through Friday, 8:00 a.m. to 4:00 p.m. Central European Time -
Phone: +46 31 337 65 00. - Monday through Friday, 7:30 a.m. to 4:30 p.m. India Standard Time -
Phone: +60 16 699 9506.
Comments
0 comments
Please sign in to leave a comment.